Most popular posts right now

Showing posts with label ice sheet. Show all posts

8 October 2025

Observations on Arctic Sea Ice Challenge the Notion of Particularly Rapid Melting

I promised at the end of September, in my Finnish-language blog, to return to the topic of this year’s Arctic sea ice situation. At that time, it was already known—based on NSIDC’s daily measurements—that the annual minimum extent was the eleventh smallest in the history of the statistics. 

Then, at the beginning of October, the data on the average sea ice area for September was released. It appears at the endpoint of the curve below, under which only the points for the years 2007, 2016, 2019, and 2020 fall. Notably, this supports the view that the ice area has remained at the same level since 2007—that is, for 12 years already. The figure also clearly shows how, in September 2012, the ice area was distinctly smaller than in any other year.

This observation supports a recently published research report by Chinese scientists, according to which the phenomenon known as the North Atlantic Oscillation shifted from the lowest point of its negative phase in the early 2010s into a positive phase. As a result, the reduced heat and moisture, as well as the weakened downward longwave radiation, have led to a slowing of Arctic sea ice melting.

According to that study, however, this slowdown in melting would be only an intermediate stage, to be followed in the 2030s or 2040s by a rapid melting of northern sea ice—and subsequently, a series of environmental disasters around the world.

At this stage, of course, it is too early to take a position on that latter risk or its likelihood. Nevertheless, it can be stated that the slowdown in the melting of northern sea ice—at least for the time being—is a fact, one that seems at least partly to challenge the idea that the climate warming responsible for melting the ice is proceeding particularly rapidly in the Arctic region.

22 May 2025

Diverging Findings in Antarctic Ice Sheet Research

Stokes and his colleagues have published a study indicating that by the end of the century, sea levels could rise by as much as a centimeter per year due to the melting of the Greenland and Antarctic ice sheets. This would happen even in the case where humanity manages to limit global warming to 1.5°C. Such a development would mean sea level rise of several meters over the coming centuries.

As a result, people living in coastal areas would need to be relocated, and buildings and other infrastructure built along the coasts would end up submerged. According to the study, a massive transformation lies ahead globally.

This study caught my attention, of course, for the reasons I briefly mentioned above. But also because Chinese researchers Wang, Shen and others have observed that between 2021 and 2023, the melting of the Antarctic seems to have turned into a net gain in ice mass.

This suggests that the results of different researchers are in some degree of contradiction. That, of course, is not unusual—let alone unique—in the scientific world, but it does offer an interesting topic to follow in the coming years.

It could be, of course, that the future projections made by Stokes and his colleagues based on a synthesis approach contain errors—or alternatively, that the increase in Antarctic ice mass observed by Wang and Shen is merely a temporary anomaly within the broader process of ice loss.

Time will tell—if not for us, then for future generations—whether we are facing a catastrophe for the world’s coastal cities or whether the effects of greenhouse gas emissions turn out to be less severe than current research suggests.

For those reflecting on the matter, a reasonable suggestion would be to monitor the changes in Antarctic temperatures over time. For example, according to data from the Vostok Station, located in the interior of the continent and operational since 1958, the warmest years there have been 2007 and 1980. The average temperature in 2007 was -52.60°C, and in 1980 it was -53.02°C.

At those temperatures, ice is unlikely to melt at Vostok—but things are different along the coast. For instance, at Casey Station, which has been operational since 1957, the highest annual average temperature on record was measured in 1980, at -6.55°C. That’s not warm enough to melt ice either, but during the summer months—December and January—average temperatures at Casey rose above freezing.

21 September 2024

Ice Sheet Losses in Antarctica and Greenland

CNN reported that the rapid ice loss of the Thwaites Glacier is set to speed up this century. The retreat of this glacier has accelerated considerably over the past 30 years. Even worse, according to the article, scientists project that Thwaites and the Antarctic Ice Sheet could collapse within 200 years, which would have devastating consequences.

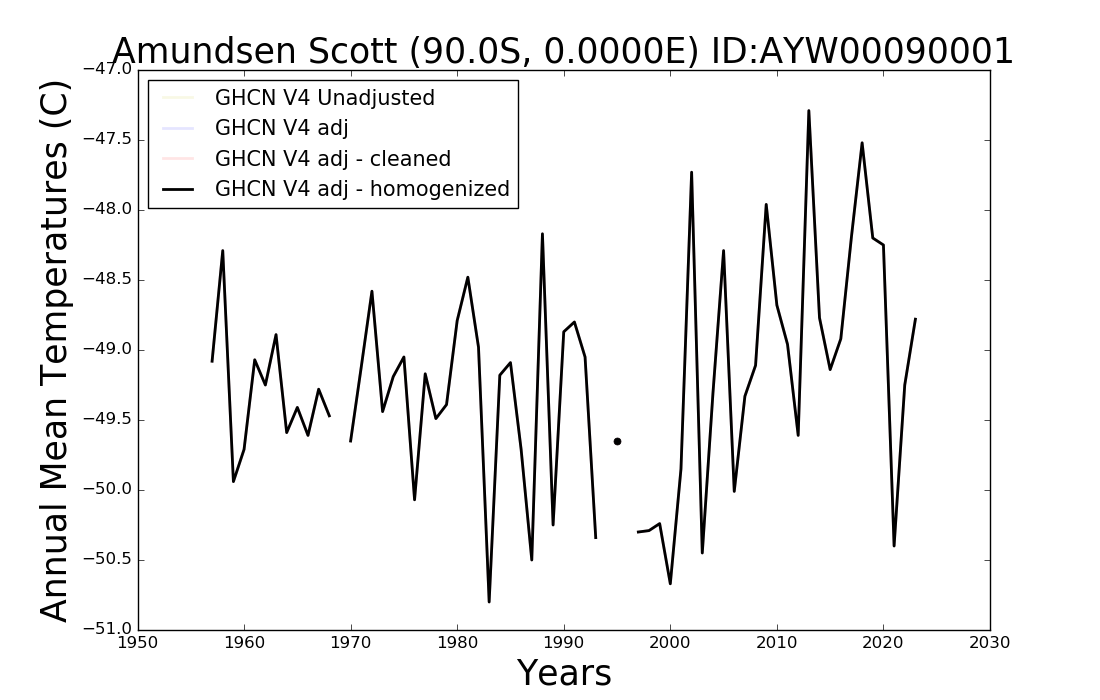
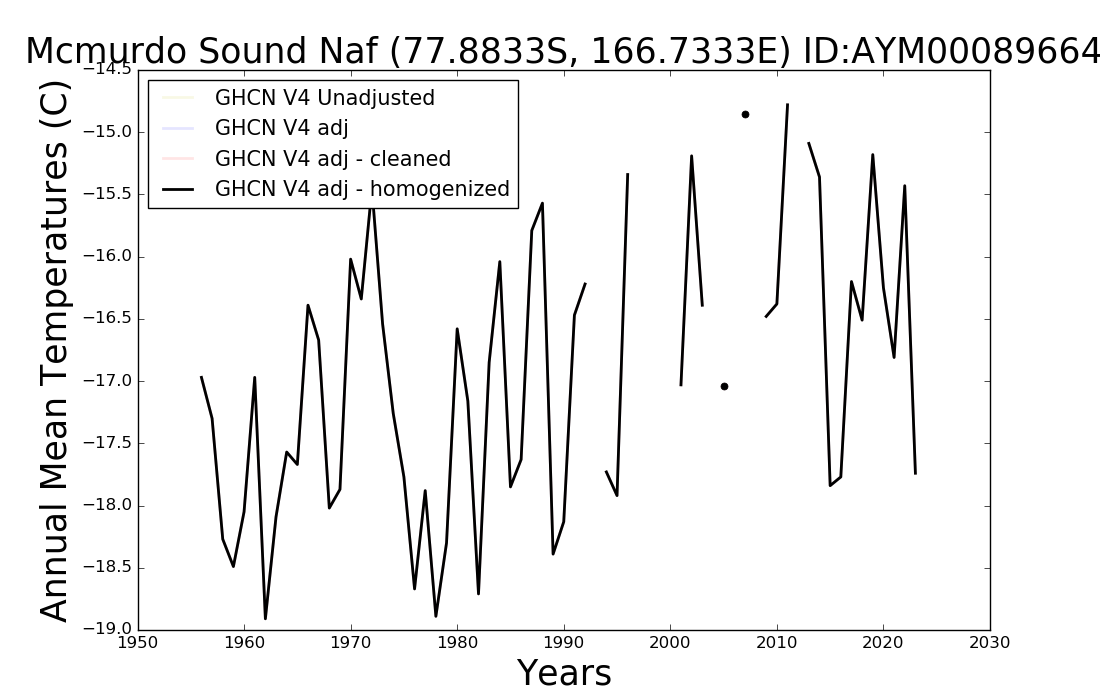
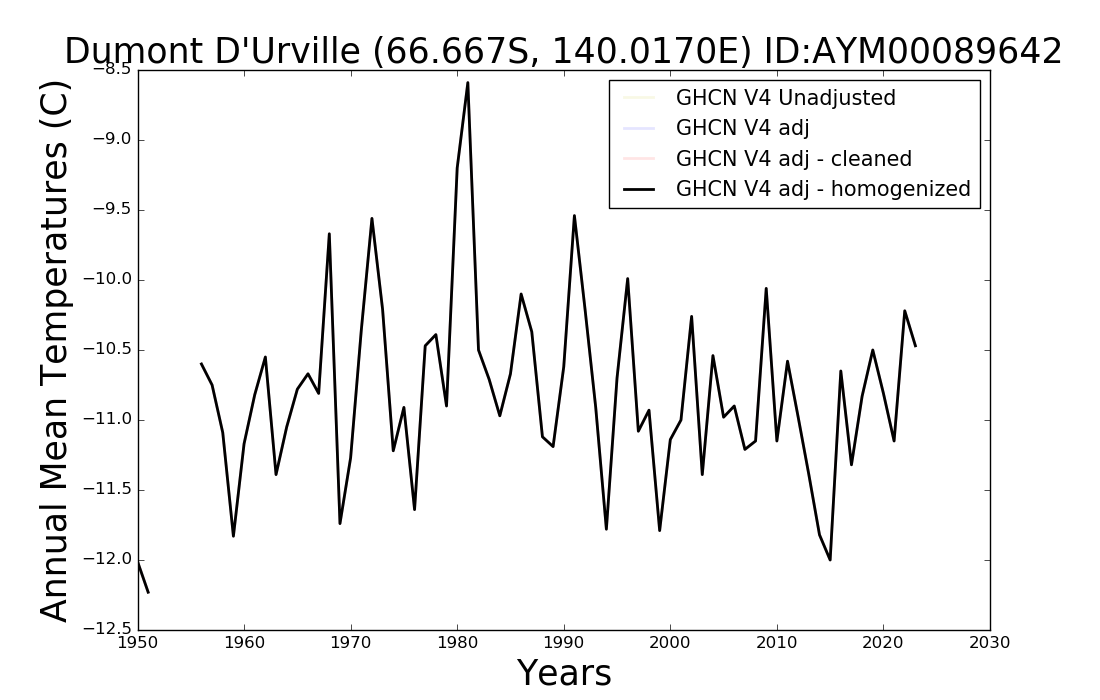
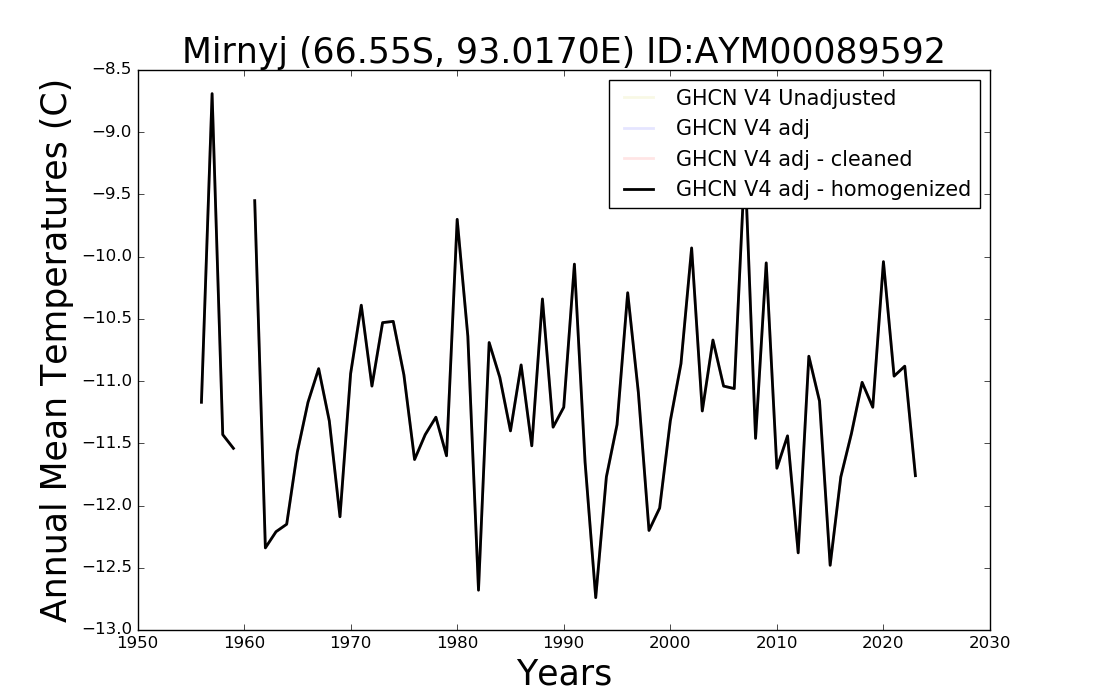
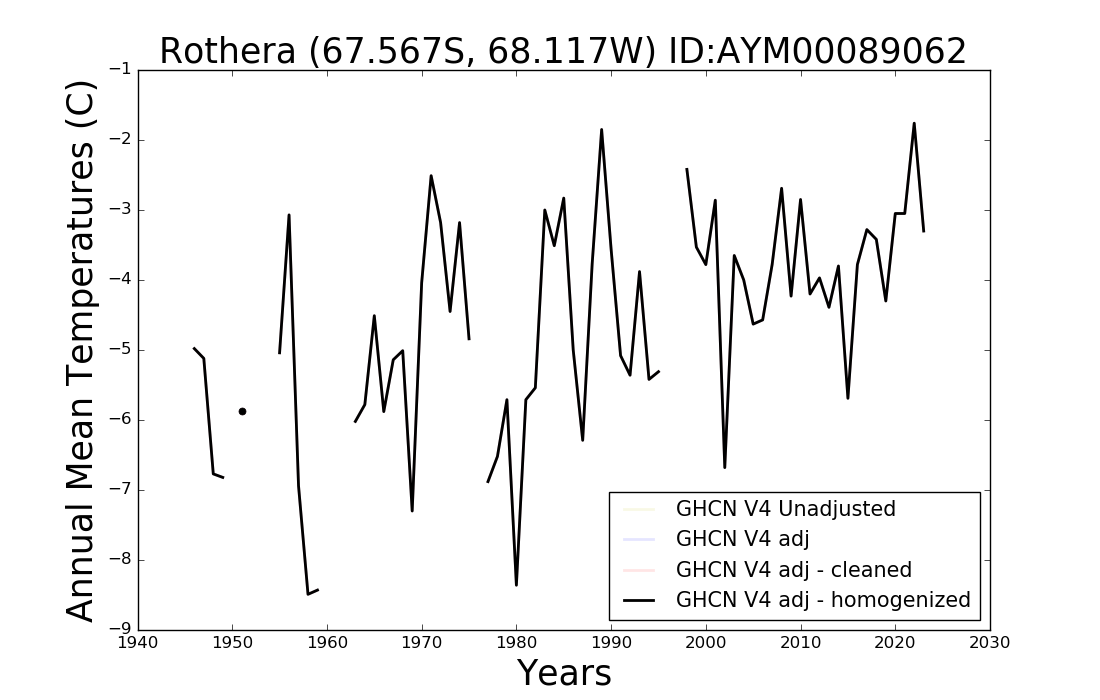
Such a development would, of course, be extremely concerning, and that’s why I decided to look into how temperatures in Antarctica have evolved. For that, I searched NASA's Goddard Institute for Space Studies website for all available time series of Antarctic temperatures that began before the 1960s.

I’ve copied the graphs I found below, starting with Vostok and Amundsen-Scott, located in the central part of the continent, followed by the stations on the continent’s edge, beginning from the boundary of the eastern and western hemispheres and moving westward (like the sun).


My dear reader can draw their own conclusions from the series of images I have copied above. As for me, I do not plan on losing sleep over the CNN article that inspired this writing.

* * *

Speaking of glaciers: it occurred to me that I had read a study by Rebecca Adam McPherson and colleagues, who work in Germany, suggesting that the melting of Greenland’s 79 North glacier, which flows into the ocean, has slowed somewhat in recent years.

While investigating this phenomenon, the researchers found that the water temperatures beneath the glacier’s ice shelf cooled between 2018 and 2021. According to the researchers, this was due to a slowdown in the North Atlantic circulation and the cooling of Atlantic intermediate waters.

This, in turn, was the result of a phenomenon observed in Europe’s atmosphere, where cold Arctic air flowed south through the Fram Strait. This phenomenon is by no means new to science; it has caused other ocean cooling events over the past half-century and will continue to be a key factor in the development of glaciers in northeastern Greenland.

As I read the study, it naturally occurred to me whether this same phenomenon could also explain why Arctic sea ice has not melted since 2013. If so, the melting of sea ice should resume sooner rather than later.