Most popular posts right now

Showing posts with label Climatic change. Show all posts

8 October 2025

Observations on Arctic Sea Ice Challenge the Notion of Particularly Rapid Melting

I promised at the end of September, in my Finnish-language blog, to return to the topic of this year’s Arctic sea ice situation. At that time, it was already known—based on NSIDC’s daily measurements—that the annual minimum extent was the eleventh smallest in the history of the statistics. 

Then, at the beginning of October, the data on the average sea ice area for September was released. It appears at the endpoint of the curve below, under which only the points for the years 2007, 2016, 2019, and 2020 fall. Notably, this supports the view that the ice area has remained at the same level since 2007—that is, for 12 years already. The figure also clearly shows how, in September 2012, the ice area was distinctly smaller than in any other year.

This observation supports a recently published research report by Chinese scientists, according to which the phenomenon known as the North Atlantic Oscillation shifted from the lowest point of its negative phase in the early 2010s into a positive phase. As a result, the reduced heat and moisture, as well as the weakened downward longwave radiation, have led to a slowing of Arctic sea ice melting.

According to that study, however, this slowdown in melting would be only an intermediate stage, to be followed in the 2030s or 2040s by a rapid melting of northern sea ice—and subsequently, a series of environmental disasters around the world.

At this stage, of course, it is too early to take a position on that latter risk or its likelihood. Nevertheless, it can be stated that the slowdown in the melting of northern sea ice—at least for the time being—is a fact, one that seems at least partly to challenge the idea that the climate warming responsible for melting the ice is proceeding particularly rapidly in the Arctic region.

3 September 2025

Stalled Melting of Northern Polar Ice Buys the West Time to Strengthen Arctic Capabilities

One of my greatest interests is the visibility of predicted climate change in the surface area of northern sea ice. Therefore, dear readers, allow me to return once again to this topic, as I have not reported on it for some time in this English-language blog.

According to the August statistics, the average surface area of northern sea ice last August was the seventh smallest in its recorded history, which began in 1979. This was because, over the past year, the ice cover was larger than in August of 2024, 2020, 2019, 2016, 2012, and 2007.

This fact fits well with the already established picture that northern sea ice shrank rapidly from the 1990s until 2007, after which its surface area has shown nothing more than random variation. This reality is also illustrated in the figure I have drawn below, where the X-axis shows the ice area in millions of square kilometers and the Y-axis shows the years.


The maximum extent of Arctic sea ice is usually reached in September, so later this month we will see whether the amount of navigable, ice-free water in the Arctic Ocean exceeds that of previous years. Based on the above statistics, this does not seem likely—but neither does it seem entirely impossible.

The size of northern sea ice naturally has its own scientific significance, particularly in the context of the threat of climate change. In addition, it carries major practical geopolitical importance, since during President Trump’s administration the United States has observed that Russia is clearly ahead of others in this respect.

In this sense, the slowdown of ice melting is very good news for the free Western world, as it gives the U.S. and other nations interested in northern maritime regions more time to build up their own capacities for operating in the Arctic. At the same time, this particularly benefits my home country of Finland, which is indisputably the world leader in building icebreakers and stands ready to offer its expertise to other nations as well.

Previous thought on the same topic:

13 July 2025

Climate Warning Signs Were There 130 Years Ago – If Only We Had Noticed

Today, climate change is a scientific dogma—questioning it is no longer seen as acceptable. But this wasn’t always the case. According to a recent American study, the effect of carbon dioxide on the atmosphere’s ability to retain heat wasn’t understood until the mid-19th century.

At the same time, the use of fossil fuels began rapidly increasing atmospheric CO₂ levels, but it would still take a long time before the phenomenon even became a subject of scientific concern—let alone the broad societal issue it is today, influencing a vast range of topics.

The study in question explored when climate change could have been detected if 19th-century scientists had access to today’s climate models and observational networks. To do this, the researchers assumed that by the year 1860, it would have been possible to make precise measurements of atmospheric temperature changes. They then determined when a human-caused climate signal would have become detectable.

According to the report, significant cooling of the middle to upper stratosphere—primarily caused by rising levels of CO₂ from human activity—would have been clearly detectable by around 1885. That’s during the height of European imperialism, and well before the invention of gasoline-powered cars.

These findings could have been made based on the favorable signal-to-noise ratio in the mid- to upper stratosphere, where the human-induced cooling is strong and displays distinct patterns that differ clearly from natural variability.

The researchers noted that atmospheric measurement capabilities in 1860 were far from global; high-quality stratospheric temperature measurements would have only existed for mid-latitudes in the Northern Hemisphere. Nevertheless, human-caused stratospheric cooling still would have been detectable by 1894—nearly a decade before the Wright brothers’ first flight.

Previous thoughts on the same topic:
National Identity in Stone: Finland’s Ancient Crust Meets Canada’s Hadean Record 
Why Did the Cause of Pierce’s Disease in Grapevines Spread to Europe Only in 2013?
Availability of coffee in a warming world

3 May 2025

Big Deal in the Cold North: Finland vs. Canada

The past winter was exceptionally warm in Northern Europe – according to a recent study, it was even the warmest in at least 2,000 years. That’s why it is interesting that in April, the extent of Arctic sea ice was only the ninth smallest in recorded history (see figure).


This was the case despite the fact that in March, the sea ice area in the north was the smallest since satellite records began in 1979, and April was also warmer than usual in Finland. It remains to be seen whether the Arctic Ocean will melt enough by autumn for the sea routes passing through it to gain renewed attention.

This is also tied to the fact that Finnish and Canadian shipbuilders are competing to sell icebreakers to the United States. In this respect, the Finns have a clear advantage, as only Finland currently has the capacity to build the 40 icebreakers that the U.S. needs – which may be the reason why Canada has offered the U.S. the possibility of building Canadian-designed icebreakers on U.S. soil.

However, in this context, one might imagine that the U.S. would take note of the fact that even the Canadians have just ordered an icebreaker from Finland. And so, to play it safe, they might place their order with Finland as well.

On the other hand, it is clear that 40 icebreakers cannot be built in a year or two, and for that reason, the Americans might well split the order between the competing parties. It remains to be seen how this competition will play out – or whether the entire Arctic will melt to the point that, in three years' time, there will be little to no need for icebreakers in the Arctic Ocean at all.

3 January 2025

The Northern Sea Ice Area in 2024 Was Not the Smallest on Record

The year 2024 was apparently the warmest year in recorded temperature history. Therefore, I decided to examine the development of the northern sea ice area this year based on data collected by NASA's National Snow and Ice Data Center.

According to recent statistics, however, the northern polar ice defied my expectations. Its area was not the smallest on record but larger than in 2007, 2016, 2019, and 2020 as seen in the figure below. 


Additionally, its average area was not the smallest in any month of the measurement history. As I wrote earlier, in September, when the ice reaches its annual minimum area, it was the fourth smallest in recorded history.

This past December, however, the northern sea ice was the second smallest on record, so I am eagerly waiting to see what happens in January. Could it possibly shrink further than in previous years, giving hope for the opening of the Northeast Passage for maritime traffic?

22 November 2024

Why Did the Cause of Pierce’s Disease in Grapevines Spread to Europe Only in 2013?

Greenhouse gases have, according to measurements, increased the Earth's average temperature by nearly 1.5 degrees Celsius per year. As a result of this change, harmful pathogens may spread to regions where they have not previously been found. This applies to both alien invasive species and so-called newcomer species, which are spreading to new areas without human intervention.

Eduardo Moralejo and his colleagues have published a study examining the phylogenetics, epidemiology, and history of Xylella fastidiosa, a North American bacterium spread by insect vectors that causes Pierce’s disease in grapevine. Their research provided insight into why European vineyards have, until now, avoided this pathogen.

Before this study, it was a mystery why the export of American grapevines to France in the late 19th century to combat phylloxera did not lead to the spread of X. fastidiosa at that time. Phylogenetic analysis revealed that the most recent common ancestors of the bacterial populations lived around 1875. This timing aligns with the first epidemic caused by the bacterium in the U.S. and its subsequent spread to the southeastern United States.

Moralejo and his team also showed that continental Europe's climatic conditions were too cool from the 19th century until the early 1990s for Pierce’s disease to develop into an epidemic. Consequently, the pathogen could not establish itself or spread from the plants imported into Europe at that time, even if they had been infected.

However, the situation has changed due to global warming. As a result, the risk of epidemics has been increasing for over three decades. It remains to be seen when this bacterium will be found beyond the limited areas of Europe’s southernmost regions, where it was first detected in 2013.

Previous thoughts on the same topic:
Misleading Claims About European Forests
The amazing adventures of the German cockroach
A factory of five billion mosquitoes

21 September 2024

Ice Sheet Losses in Antarctica and Greenland

CNN reported that the rapid ice loss of the Thwaites Glacier is set to speed up this century. The retreat of this glacier has accelerated considerably over the past 30 years. Even worse, according to the article, scientists project that Thwaites and the Antarctic Ice Sheet could collapse within 200 years, which would have devastating consequences.

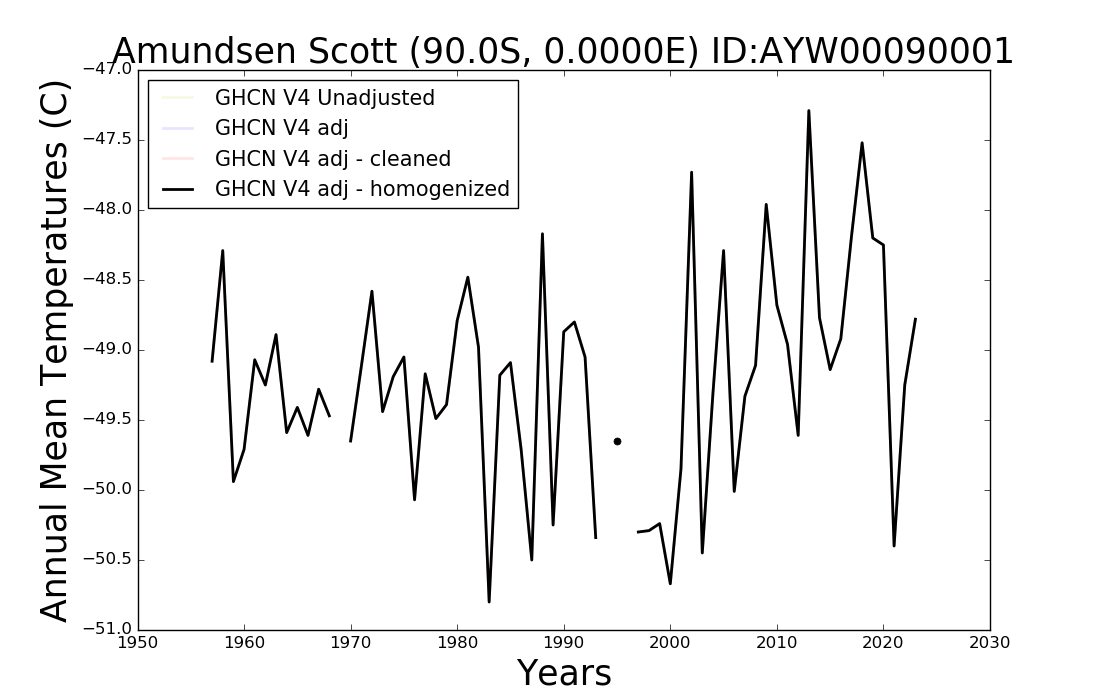
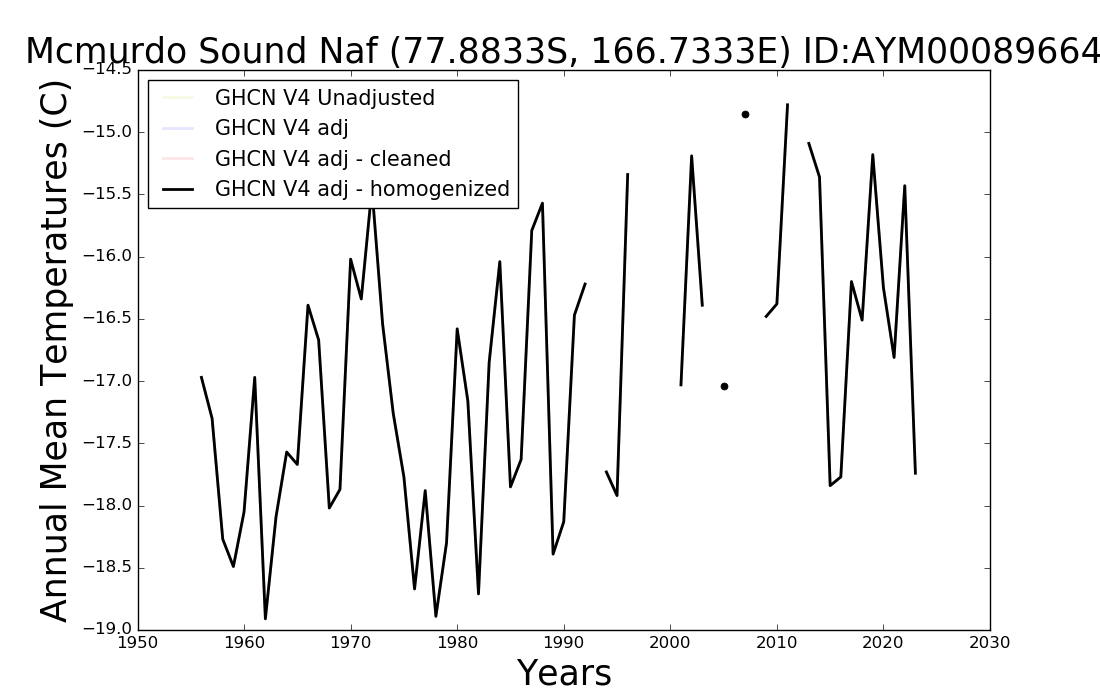
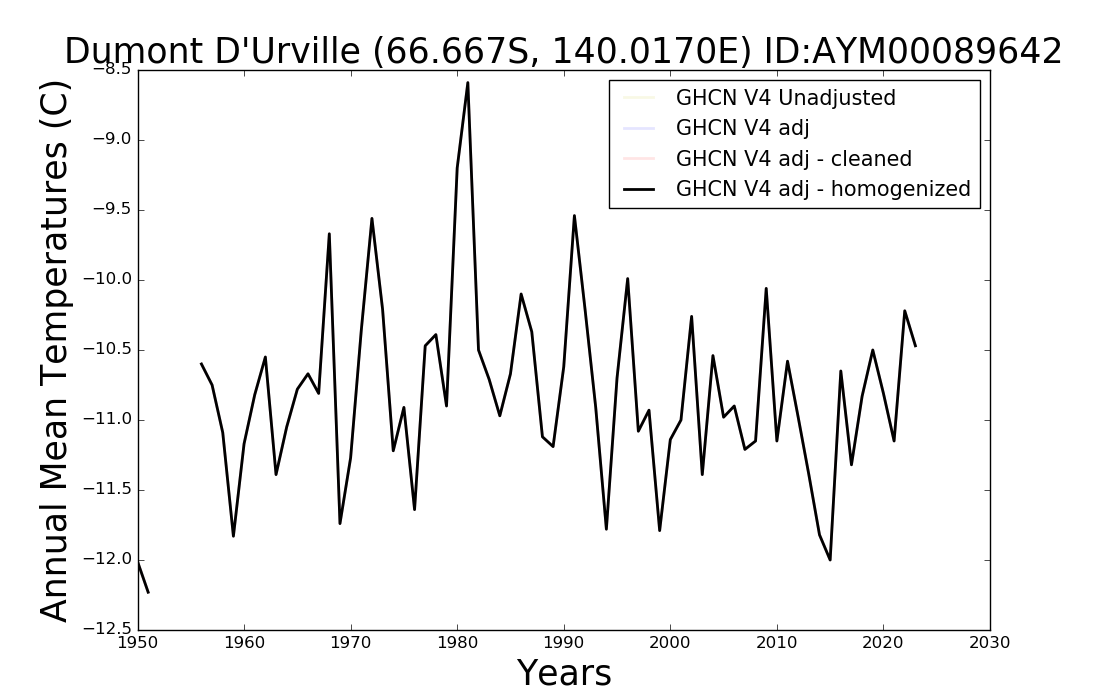
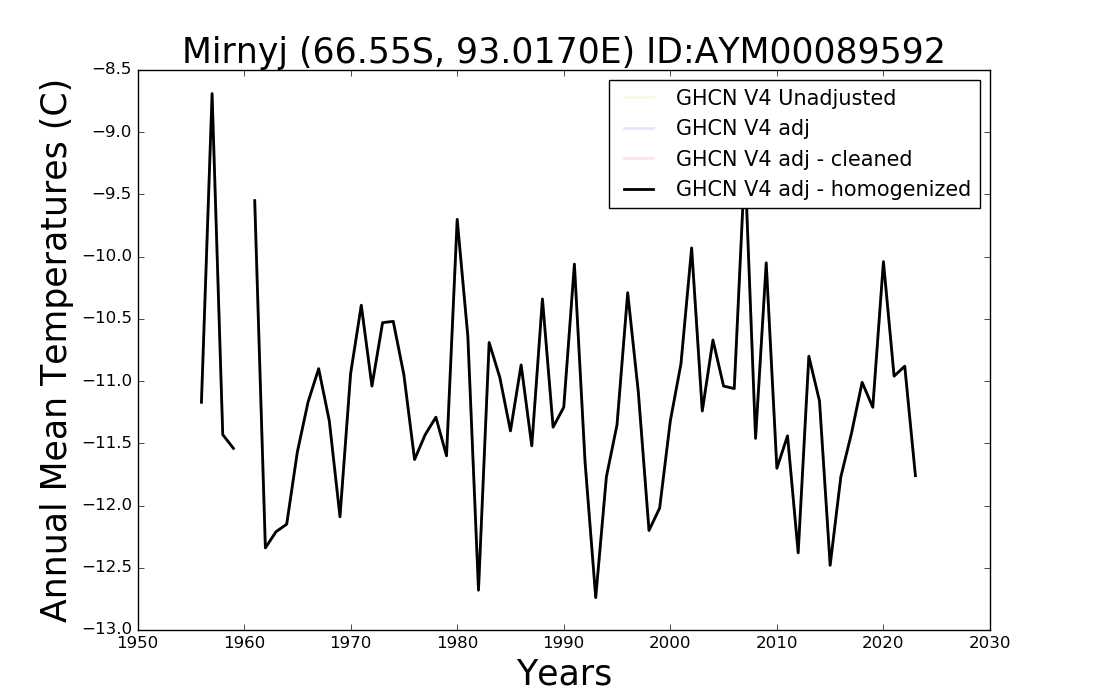
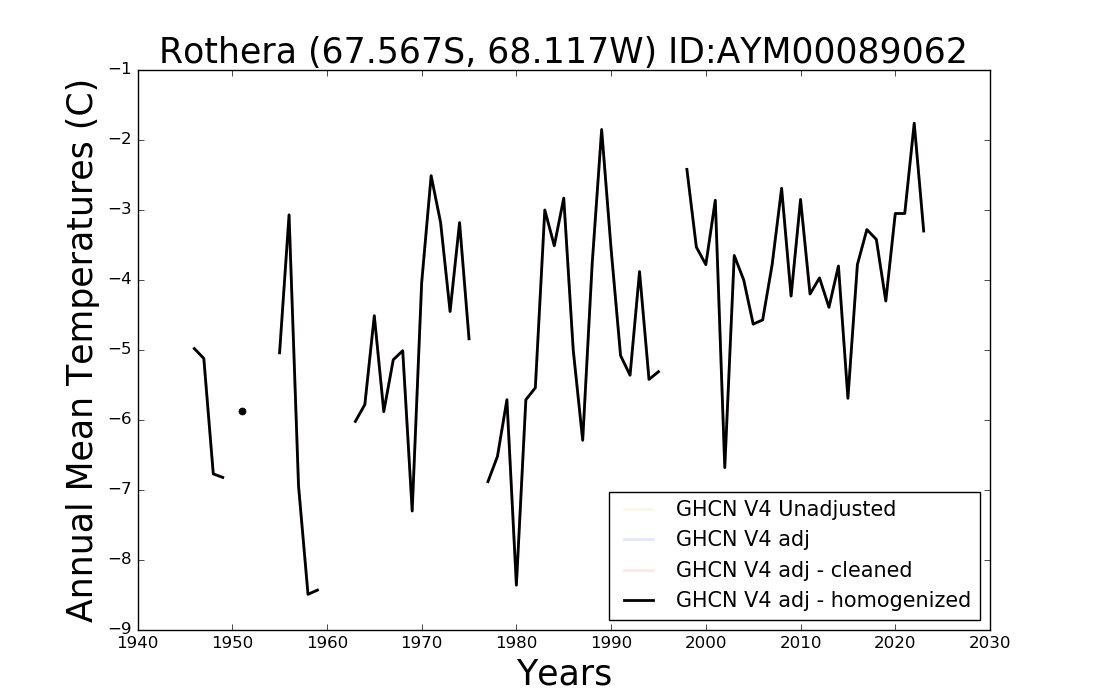
Such a development would, of course, be extremely concerning, and that’s why I decided to look into how temperatures in Antarctica have evolved. For that, I searched NASA's Goddard Institute for Space Studies website for all available time series of Antarctic temperatures that began before the 1960s.

I’ve copied the graphs I found below, starting with Vostok and Amundsen-Scott, located in the central part of the continent, followed by the stations on the continent’s edge, beginning from the boundary of the eastern and western hemispheres and moving westward (like the sun).


My dear reader can draw their own conclusions from the series of images I have copied above. As for me, I do not plan on losing sleep over the CNN article that inspired this writing.

* * *

Speaking of glaciers: it occurred to me that I had read a study by Rebecca Adam McPherson and colleagues, who work in Germany, suggesting that the melting of Greenland’s 79 North glacier, which flows into the ocean, has slowed somewhat in recent years.

While investigating this phenomenon, the researchers found that the water temperatures beneath the glacier’s ice shelf cooled between 2018 and 2021. According to the researchers, this was due to a slowdown in the North Atlantic circulation and the cooling of Atlantic intermediate waters.

This, in turn, was the result of a phenomenon observed in Europe’s atmosphere, where cold Arctic air flowed south through the Fram Strait. This phenomenon is by no means new to science; it has caused other ocean cooling events over the past half-century and will continue to be a key factor in the development of glaciers in northeastern Greenland.

As I read the study, it naturally occurred to me whether this same phenomenon could also explain why Arctic sea ice has not melted since 2013. If so, the melting of sea ice should resume sooner rather than later.

20 September 2024

Russia Pays the Price for Its Foolishness

Vladimir Putin's Russia has intended to make the Northern Sea Route, which runs along the northern coast of Asia and through Russian-controlled waters, a major shipping lane. Behind this plan is not only the economic benefit for Russia but also the assumption that the shrinking of Arctic sea ice would make the route more navigable.

However, the volume of this shipping traffic is expected to fall to almost half of what was planned, leading Russia's state nuclear energy corporation, Rosatom, to sharply lower its forecast for the amount of cargo traffic on the Northern Sea Route by 2031.

This follows Putin's directive that at least 80 million tons of cargo should pass through the route this year and 200 million tons by 2031. In reality, the volume of cargo traffic is expected to reach only about half of the planned figures.

Another reason is that the Arctic sea ice has not melted as predicted since 2013, when it was at its lowest extent in recorded history. As a result, regular traffic is only feasible in the western part of the Northern Sea Route, because the ice conditions in the eastern part, east of the Gulf of Ob, are more difficult and require continuous support from heavy icebreakers.

It may well be that Russia's next step to increase the use of the Northern Sea Route will be to expand its icebreaker fleet. However, this requires both time and money, the latter of which is being spent every single day in Ukraine, where Russia's army invaded due to President Putin's megalomania.

It is therefore quite possible that the Northern Sea Route will not become a major shipping artery for a long time, and Russia will not be able to boost its economy through it. This proves the old saying that stupidity has a price. Putin´s stupidity.

Previous thoughts on the same topic:
Reevaluating Arctic Sea Ice Melt: A Closer Look at Trends and Predictions
Medieval trade ranged from North America to Ukraine
A new route for the Ukrainian crops

29 August 2024

Reevaluating Arctic Sea Ice Melt: A Closer Look at Trends and Predictions

According to a recent survey, as many as 70 percent of Finnish schoolchildren suffer from mental health issues. A significant cause of this is the news coverage related to climate change and the environment, which has driven even the most gifted young people into deep anxiety.

For this reason, I once again decided to analyze the melting of Arctic sea ice, which has been claimed to result in ice-free waters by the 2030s. Based on the statistics, I created the following image using data from the National Snow and Ice Data Center's dataset "All daily (single day and five-day trailing average) extent values in one file, updated daily," which officially begins in 1987 (prior to this, the dataset only contains data for every second day).

From this dataset, I extracted the minimum extent of Arctic ice for each year and plotted the following image, which shows the annual minimum extent of Arctic ice, its five-year moving average, and a linear trendline generated by Excel, which I manually extended across the entire chart.

From the red five-year moving average, it can be seen that the ice melt can be divided into three phases. From the start of the dataset until the mid-1990s, it was slow, but then accelerated for over a decade, reaching its minimum in 2013. After that, the melting slowed down again.

The black regression curve drawn on the chart for the entire dataset, however, shows that if the trend were to continue as it has in the recorded data, the Arctic sea ice would likely not be ice-free even by 2050. Therefore, the melting predicted by climate scientists for the 2030s must be based on other factors.

To understand this, I drew another image, in which I manually fitted a straight line that follows only the rapid melting phase in the middle of the dataset, aligning with the red five-year moving average. This appears as a green line in the image below.


As my esteemed reader will notice, this line corresponds to the scientific prediction of ice melt in the near future. Thus, it seems that the forecast in question—despite being mathematically and scientifically complex—is ultimately based on a development that would occur if the ice melt follows the trend from the late 1990s to 2013.

But what about the events in Arctic sea ice melting after 2013? To understand this, I performed a similar manual line fitting operation based on the post-2013 data. This is shown as a blue line in the diagram below.

As my esteemed reader will notice, this "data fit" also indicates a downward trend, but a very gradual one. And if this trend prevails in the Arctic, no living person today will witness an ice-free Arctic Ocean. Not even their children.

Therefore, I would hope that media coverage of climate change, and especially the melting of Arctic sea ice, would be less sensationalist and instead highlight the factors that suggest extreme views are unlikely to materialize. These also indicate that the models predicting rapid climate change still involve vast uncertainties, suggesting that humanity most likely has ample time to adapt to the ever-changing environment.


3 July 2024

Climate Model Predictions and the Reality of Arctic Sea Ice

Climate change caused by humans is expected to be particularly rapid in the Arctic region. As a result, the northern sea ice is expected to melt, perhaps as early as the next decade.

These predictions are based on such complex climate models that even researchers cannot fully understand them, let alone ordinary tax-paying citizens. Therefore, it is extremely interesting to follow the statistics on ice area development published by the National Snow & Ice Data Center (NSIDC).

NSIDC publishes ice area statistics monthly. And now the statistics for June are available, from which I drew the picture below.


As seen in the figure, the ice area in June has varied over the years, but it is not possible to say that it has decreased any further since 2007. It remains to be seen when its development will return to the downward trajectory predicted by climate models—or if it will at all.

In addition to the Arctic ice area, the NSIDC publishes daily statistics on ice extent, which differs from area in a similar way that the surface area of a slice of Swiss cheese including the holes differs from its area without the holes. According to this statistic, the ice extent yesterday was the fourteenth largest for that date in its measurement history.

I have been following these statistics for a long time and have been puzzled by the fact that they are rarely reported in the media aimed at the general public. However, I am sure that many readers would find following the melting of the northern sea ice quite interesting.


11 June 2024

Can climate models predict the distribution of warming?

According to climate models, greenhouse gases warm the Arctic region faster than the rest of the world, although there is some discrepancy between their predictions and actual measurements. Therefore, it has been more than interesting to follow the development of the northern sea ice over the years.

The National Snow & Ice Data Center (NSIDC) publishes two statistics on its development: the extent of the ice and its area. Of these, daily data is available for the extent, but only monthly averages for the area.

Now that India has suffered from an unprecedented heatwave and southern Europe has also been reported as one of the areas experiencing the most exceptional temperatures, it has been interesting to note that the latest data on the extent of the northern ice shows it is the 37th largest, or 10th smallest, for this time of year in the measurement history starting from 1979.

The monthly area statistic of the northern polar ice surprises even more, as in May, the ice area was the 23rd largest, or 24th smallest, in the statistics, thus roughly at the median value of the statistics. Therefore, the area of Arctic sea ice does not support the idea that the climate is warming fastest in the Arctic region. And even the estimate based on ice extent supports that only weakly.

All this raises questions about the ability of climate models to predict the distribution of warming caused by greenhouse gases across different parts of the globe. Or alternatively, about the reliability of climate statistics: in this regard, the measurements of the Arctic ice cover, carried out with easily interpretable methods, are surely among the most reliable, even though the two different measurement methods of the NSIDC produce surprisingly divergent views of the size of the northern polar ice cover.

7 February 2024

The area of Arctic sea ice was exceptionally large in January

According to climate models, the world is warming frighteningly fast. And even faster in the Arctic sea ice area, which, according to a fairly recent study, entered a state in 2007 from which its surface area cannot recover through normal climate variability.

Recently, it has also been reported that the temperature of the Earth's oceans during the past El Niño year has been the highest in recorded history. As well as the average global climate temperature.

Based on these premises, one could assume that the current January area of Arctic sea ice would be exceptionally small, and its maximum size this winter would be smaller than ever before in recorded history. Or actually, this assumption could be considered a hypothesis derived from the prevailing climate theory nowadays.

So, I went to check the statistics maintained by the National Snow & Ice Data Center on January sea ice areas. Looking at this data series that started in 1979, I was amazed and decided to list the information it contains in the table below.


From the table, it can be seen that the January sea ice area in the Arctic was the 21st largest in its 46-year (the table only includes 45 years due to missing data for the year 1988) observational history. This is clearly larger than the median value of the dataset. Additionally, we notice that the situation was very similar two years ago in 2022, when the ice extent was even larger than this past January.

Therefore, it is interesting to follow how the northern sea ice will develop by the end of this year's autumn. By then, its area should reach its minimum size and perhaps even melt to a smaller area than in 2012, when it was historically at its lowest. 

7 January 2024

Does Arctic sea ice melt as atmospheric greenhouse gases increase?

According to the Finnish Meteorological Institute, the past year in Finland has been somewhat warmer than usual. According to its measurements, "the average temperature for the entire country was about 3.2 degrees, which is 0.3 degrees above the long-term average of the years 1991‒2020. The annual average temperature ranged from a little over +7 degrees in the southwestern archipelago to about -1 degree in the northwestern part of Lapland."

In contrast, the past year in China was the hottest in its entire recorded history. Additionally, according to Helsingin Sanomat, it "experienced several extreme weather events and heatwave periods" last year.

Not surprisingly, December's news reported that the past year was the hottest in the world's recorded history. Therefore, it was intriguing to revisit my old hobby of studying the development of the Arctic ice cover. According to climate models, it should be warming faster than the rest of the world due to the increasing atmospheric carbon dioxide.

The figure below shows the annual variation in the ice cover's average area throughout its measurement history.


It can be seen that despite the exceptionally warm year according to measurements taken at ground-level weather stations, the average size of the Northern polar ice cap has actually been trending more towards growth than shrinkage in recent years.

In the next figure, I drew an even more interesting graph. It represents the average size of the Northern sea ice in September - that is, the area during the month when the ice is at its minimum.

As my esteemed reader may notice, the area of the Northern sea ice was quite small last September. Not the smallest in recorded history, but the second smallest.

Therefore - or despite it - I delved with great enthusiasm into the task that I have been tackling year after year. That is, the statistical analysis of the relationship between the concentration of the most crucial greenhouse gas, carbon dioxide, and the average size of the Northern sea ice in September.

In this analysis, I have taken as a starting point the hypothesis of climate models suggesting an accelerating climate change over time, which, according to these models, should be most rapid in the Earth's Arctic zone. As we all know, the ice should indicate this change through both the direct impact of warming in the Northern polar region and the increasing heat energy brought by warmer water from southern currents.

Unfortunately, I was disappointed as the picture was very similar to the previous year's corresponding analysis, as shown in the illustration below.


In the figure, the blue columns represent the number of years for which statistically significant dependence between atmospheric carbon dioxide concentration and the September average size of the Northern sea ice is observed using data from each respective year. As my esteemed reader can observe, this analysis clearly supported the climate models' prediction of global warming from the beginning of the measurement history until the year 2001.

From the year 2002 onward, I have drawn only red columns. Red, because there is no statistically significant dependence between atmospheric carbon dioxide and the Northern sea ice after that year.

The height of the red columns indicates the number of years of data available for each column – for example, for the year 2002, the available data includes the years 2003-2023, totaling 21 years. This is a significant eleven years longer than the statistically significant data starting from 2001.

In simple terms, this means that the annual minimum size of the Northern sea ice did indeed decrease as atmospheric carbon dioxide increased until the year 2001. However, the subsequent increase in greenhouse gas levels has not had a significant impact on the size of this ice cover. Thus, this analysis falsifies or disproves the claim derived from climate models that the Northern polar ice is melting due to the increase in atmospheric carbon dioxide concentration – or greenhouse gases in general.

2 December 2023

The increase in carbon dioxide concentration warms more than anticipated

I have previously followed with great interest the progress of climate change. In doing so, I have personally observed how ground-level measurement data has been retrospectively altered in such a way that there may not be reality-based justifications, such as changes in the location of thermometer or adjustments for temperature changes due to urbanization.

Therefore, my interest has shifted mainly to monitoring the surface area of the Arctic sea ice because I find its distortion quite challenging or downright impossible. To my satisfaction, I have also noted that there have been no significant changes to these statistics.

Today I read a recent study that measured the impact of atmospheric carbon dioxide concentration on the lower atmosphere's temperature. Increasing it (CO2) has so far been thought to have a direct effect on the global average surface air temperature.

However, this is not the case, as Haozhe He et al. found that doubling the atmospheric CO2 concentration increases the impact of CO2-induced growth by about a quarter. In other words, the more anthropogenic CO2 emissions accumulate in the atmosphere, the more serious the consequences.

In essence, He et al. presented a prediction - or hypothesis - that the lower atmosphere's temperature should rise more rapidly as the climate warms. Therefore, I plan to monitor how this is reflected in the fluctuations of the Arctic sea ice area - above all, whether it begins to melt again after statistically remaining the same size for over a decade despite the increase in CO2 concentration.

Previous thoughts on the same topic:
The record-breaking warming of the oceans is not visible in the Arctic
Record low temperature in northern Finland
Arctic sea ice contradicts with the climatic model predictions, but is that changing now?

26 July 2023

The record-breaking warming of the oceans is not visible in the Arctic

The most important newspaper of Finland, Helsingin Sanomat, took a stance in its editorial on Minister Kaj Mykkänen's (National Coalition Party) comment, according to which the key climate action in Finland is to plug factory chimneys. A couple of days ago, I also commented on this matter in Finnish, pointing out that human progress is based on science and technology – and reminding that insect infestations threaten forest carbon sinks in a warming climate.


Climate change has also been commented on by Petteri Taalas, Secretory General of the World Meteorological Organization, who says that the problems predicted by climate researchers in the Greek archipelago back in the 1980s are now becoming a reality. This led me to once again look at the development of northern sea ice extent. One might imagine it melting rapidly right now, given that the surface water of the North Atlantic is warmer than ever in recorded history.

My surprise was significant when I observed that the extent of northern sea ice on July 24th, relative to this time of year, was the tenth smallest in the statistics. The years 2007, 2011, 2012, 2013, 2016, 2017, 2019, 2020, and 2021 were surpassed.

However, it is true that the last time I wrote about the subject in English, sea ice was 12th smallest, so its relative extent compared to recent years has decreased. On the other hand, compared to the record year 2012, the extent of northern sea ice is over five percent larger – when I wrote about it in Finnish, the difference was just under five percent – so in that respect, it has expanded rather than contracted. This could, of course, be due to the exceptional anomaly of the year 2012.

So, we'll see if the warm water from the North Atlantic finally flows to the Arctic region and begins to melt the northern sea ice. And thus, would bring closer the day – which climate researchers say is inevitably ahead – when the Arctic ice completely disappears.

Aiempia ajatuksia samasta aihepiiristä:
HS katkeroituneen naisen työkaluna

3 July 2023

The activists sought excitement and a boost to their self-esteem in the Stockholm Diamond League

Climate activists disrupted a star-studded athletics competition yesterday in Sweden by blocking the track with 400-meter hurdles. This upset the competition's winner, Norwegian Karsten Warholm, who said, "it is completely idiotic. It should be allowed to protest, but that is sickeningly bad. That's not the way to do it, no matter what it's about". 

The activists themselves claimed, "we are doing this because people die every day from the climate disaster. Politicians do not act. We need to raise this issue."

However, especially in Europe, politicians have taken significant action to mitigate climate change. The European Union, in particular, has made a decision to become climate-neutral by 2050 at the latest. Additionally, as an interim goal, it has been decided to reduce carbon dioxide emissions by 55 percent by 2030.

In other words, the activists' justification is not valid, and there seems to be an entirely different reason behind their actions. It is likely driven by a disregard for others and a search for excitement, as well as a boost to the participants' self-esteem. This is evident considering the significant attention it received worldwide.

* * *

In this context, it is also worth looking at how the climate has evolved in the Arctic region predicted to warm more rapidly than other parts of the world. The timing is ideal as the NSIDC (National Snow and Ice Data Center) has just released data on the extent of Arctic sea ice for the past month.

According to the data, the ice extent surrounding the North Pole was slightly larger this year´s June compared to the years 2022, 2021, 2020, 2019, 2017, 2016, 2012, 2011, 2010, 2007, 2006, and the same as in 2015. To get a better understanding of the situation beyond a series of years, it is helpful to examine the development of ice extent visually.


From the image, we can see that the extent of Arctic sea ice in June has been quite variable but has decreased over the years surrounding the turn of the millennium. In recent years, it has remained stable, and no further ice melt has been observed. 

1 June 2023

Record low temperature in northern Finland

This spring has been relatively warm in Finland, as expected considering the commonly known predictions of a warming climate.

However, it is worth noting that last night in Kilpisjärvi, located in the northernmost region, the temperature reached a record low for the month of June at -7.7 degrees Celsius. This temperature was 0.7 degrees lower than the previous record set in 1962

It's important to note that this observation does not imply that climate change has been canceled. Instead, it perhaps indicates that the extent of warming is not yet very significant. One possible explanation could be that global temperatures have decreased since 2016, as indicated by satellite data.

The satellite data also aligns with measurements of the arctic sea extent, which currently show a considerable increase compared to the same time in 2012, 2016, and many other years. This hiatus has been attributed to the prolonged La Niña period and the absence of El Niño since 2016.

However, it appears that the long-awaited El Niño may be starting, which makes it extremely interesting to see whether the temperature records from the last decade will be surpassed both globally and locally in the Arctic region. Could it even be possible that next year's summer will set a new temperature record in Kilpisjärvi? 
11 March 2023

Why are boreal forest fires on the rise everywhere but in Finland?

A research article published in Science showed that carbon dioxide emissions from fires in boreal forests have been increasing during this century, reaching a new high in 2021. Although boreal fires typically account for only one tenth of global carbon dioxide emissions from all wildfires, in 2021 they produced nearly one quarter of the total emissions.

The reason for this increase was the rare concurrence of water deficits in North America and Eurasia. This problem is exacerbated by the fact that increasing numbers of extreme weather events contribute to global warming, making it even more challenging to mitigate the effects of global change.

It is interesting to compare Finland and Sweden, two neighboring countries that are highly similar in many ways. Both countries experience relatively low levels of forest fire activity compared to other countries, but there is still a notable difference. In Sweden, 3 000 to 4 000 fires burn approximately 2 000 to 5 000 hectares annually. In contrast, Finland has a considerably lower average number of forest fires, around 1 000 per year, with each fire covering an average burnt area of only 0.5 hectares.

So, why do we see this difference? 

There are three main reasons for Finland's success in managing forest fires. Firstly, the country experiences weaker winds, which slows down the spread of fires in burning forests.

Secondly, Finnish society is well-equipped to recognize forest fires, thanks to the presence of volunteer fire brigades with superior local knowledge compared to municipal firefighters. This enables faster site location and response times.

Thirdly, the abundance of forest roads in Finnish forests allows firefighters to quickly reach burning sites. Despite being narrow, these roads are effective in slowing down the spread of fires by creating breaks in the continuous forest cover.

Given that forest fires pose a continuous risk to the global climate, other nations could benefit from adopting Finnish practices and techniques to manage such disasters.

Previous thoughts on the same topic:
Fair policy will build a strong Union
A new justification is needed for environmental activists
Historical context of forest fires in Kalajoki (Written in Finnish, but readable in English using Google Translate)

4 February 2023

Global warming - searching for the guiltiness

The predicted climatic warming by greenhouse gases is one of the big questions of our time, which determines even economic options of the future. Therefore it was interesting to read about an analysis, which gives estimates about the contribution of different countries in this threat.

The first calculation presented a simple calculation of the total amount of carbon dioxide including emissions from fossil fuels as well as from land use and forestry since 1850 up to 2021. There USA is clearly in the first place by its 20 per cent share, and followed from distance by China, Russia, Brasil, Indonesia, Germany, India, United Kingdom, Japan and Canada. 

The second calculation is based on the cumulative consumption of each nation. It only covers years from 1990 to 2021. In this calculation top ten includes the same countries as above, and in the same order. Therefore, often highlighted guiltiness of outsourced carbon emissions is not a major issue, although it adds to the share of responsibility accorded to wealthy nations.

The two other calculations are based on emissions per capita, but using different approaches. The first one takes a country’s cumulative emissions in each year and divides it by the number of people living in the country at the time. 

According to this calculation Canadians have the highest emissions. Thereafter come people of the USA, Estonia, Australia, Trinidad & Tobago, Russia, Kazakhstan, United Kingdom, Germany and Belgium. My home country, Finland, is in the eleventh place raising it high on the list. 
  
The second approach takes a country’s per capita emissions in each year and adds them up over time, and on top of the list are inhabitants of New Zealand followed by people of Canada, Australia, United States, Argentina, Qatar, Gabon, Malaysia, Republic of Congo and Nicaragua. Finland is not among the top 20. 

Taken together, the four classifications above shows that carbon emissions are not a simple case. And therefore politically active actors may select the list that best serves their purposes. 

Therefore all of us, who are targeted, should be cautious, and put the claims in a frame. For example, as a Finn, I should agree that consumption of me and my national fellows are causing considerable amounts of carbon compared to most other people, but also remember that our total share of the global emissions is like a drop in an Ocean. And to understand, that our high per capita emissions is largely caused by our geographic location in a cold climate as well as the large area of the country resulting in a higher need of domestic travel than in most other countries. 

Actually, I would have liked to see a calculation, where the cumulative consumption of each nation would have been divided by the area of the countries. As a Finn, I would happily prefer to use that as the most important criterion in evaluating the position of each nation in causing the increase of greenhouse gases in the atmosphere.  

My argument is based on the fact, that such a statistics would not reward nations from their increasing population - as the two per capita calculations above do - but rather encourage the nations with exploding population sized to act on this main cause of the global environmental crisis including climate, biodiversity and land use aspects.

7 January 2023

Arctic sea ice contradicts with the climatic model predictions, but is that changing now?

One of the items I am deeply interested is the development of the climatic change in the Arctic area. For that purpose, I have made statistical analyses on the dependence between the atmospheric carbon dioxide concentration and the area of the arctic sea ice.

I published today my most recent analysis in Finnish, and decided also to write a short summary of that in English. I have also previously written a post on this topic into this blog, and recommend reading it in case you - my highly valued reader - are interested in details of this analysis. 

The idea of the analysis is simple: I am using September data (i.e. annual minimum) for arctic sea ice area of the National Snow & Ice Data Center (NSIDC) and carbon dioxide concentration measurements conducted in Mauna Loa. The latter ones are not available for year 2022 due to the eruption of the volcano, and therefore I had to use an estimate based on two previous measurements. The development of the concentration is given in the figure below, where the measured concentrations and estimated value are marked with blue and red color, respectively.


In the next figure I have marked the number of years after which a connection between the carbon dioxide concentration in the atmosphere and the area of the Arctic ice sheet is statistically significant in two consecutive years. In X-axis I marked the year from which each analysis series started.


The left side of the figure (yeasts 1979-2001) is according to the hypothesis, and the blue columns - i.e. number of years needed for statistical significance - are shortening from left to the right as predicted by the climatic models. However, starting from 2002 there are no consecutive two years with statistical significance, and therefore these columns are marked with red color. And their height is simply the number of data years used for each analysis. 

Thus, my analysis suggests that the prediction based on climatic models are supported by data from 1979 to 2001, but thereafter there is a strict contradiction between the models and observations. Normally such a discordance between observations and theory is used to falsify scientific hypotheses. I have, however, not seen that the such a decision would have been made or even discussed among the community of climatic researchers.

* * *

Before ending this blogpost, I would like to point out that the most recent daily measurements of the Arctic sea ice extent have shown an extremely interesting change, where the relative extent of the ice has decreased compared to previous years. As a result, right now (January 5th) the size of the Arctic sea ice is the second smallest ever measured (for the fifth day of each year) despite the fact that e.g. in 5th November it was only at 11th position. 

Therefore it will be extremely interesting to follow how the Arctic sea ice develops in this year. Will its development return back to the development predicted by the climatic change, or will the last weeks´ phenomenon turn out to be only a temporary exception caused by e.g. exceptional weather conditions in the Arctic region.